Combinining ABM and Neural Network
The tradional ABM is a prowerful tool that invovlves the social simulation of each individual in the model and addresses a series of “what-if” questions, which can have long lasting implications on our future.
However, the real-world implementation of ABM can suffer from slow simulations due to the scale invovlved, and the model calibration becomes challenging and very time-consuming due to the large number of parameters. To overcome these issues, Ayush et al. (2023) introduced a novel differentiable ABM framework called GradABM, which integrates the Gated Reccurrent Unit (GRU) with a tensorized ABM.).
The GradABM framework offers significant advanatgaes over traditional ABM:
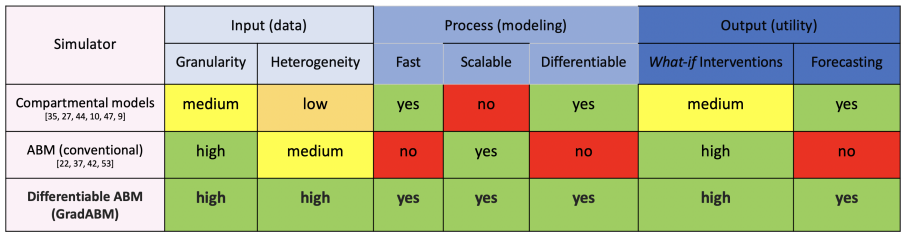
In June-NZ, we propose adopting the approach outlined in Ayush et al. (2023), and apply it in New Zealand’s context.
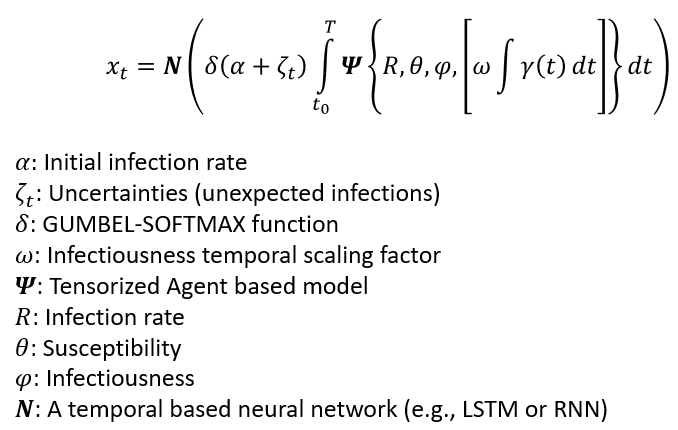
Thw following equation summarizes the process of combinining a temporal based neural network (e.g., RNN, GRU or LSTM) with a tensorized ABM.
In contrast to the original paper, in JUNE_NZ:
We have incorporated an additional uncertainty tensor in the neural network to account for agents that may not be adequately represented by the input graph representations.
Instead of using GRU, an LSTM is used to generate the condensed representations of temporal evolution of disease characteristics
The number of learnable parmaters are increased from 3 to 8 (covering the parameters from
mortality rate,exposed to infected timeto a bunch of infection related __Gamma__ function paramters.).
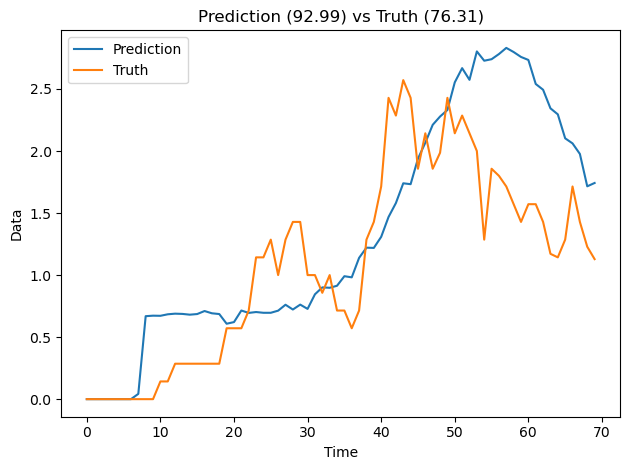
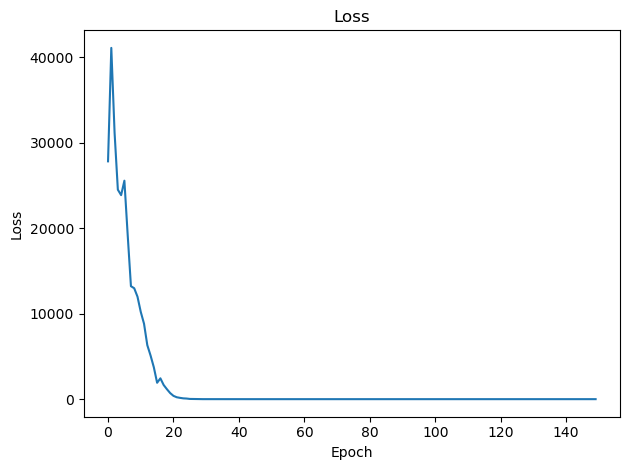
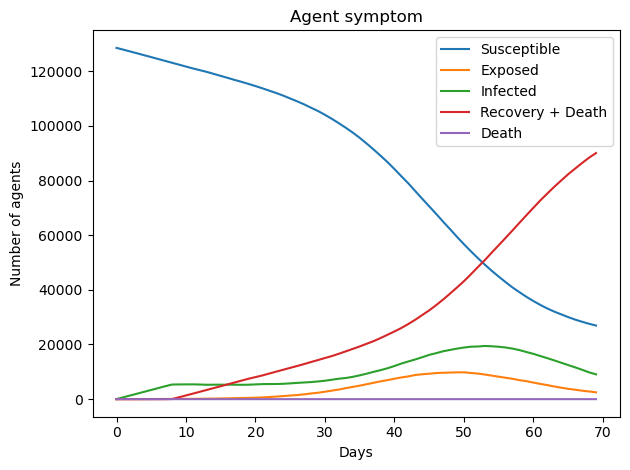
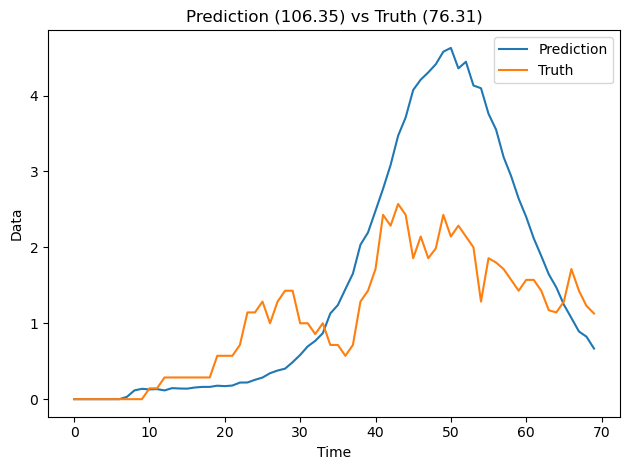
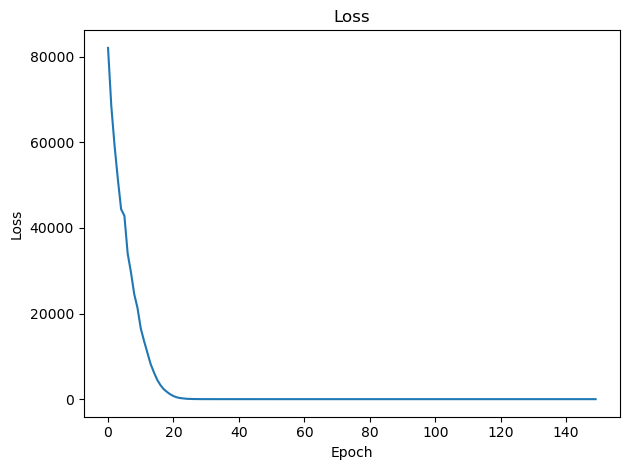
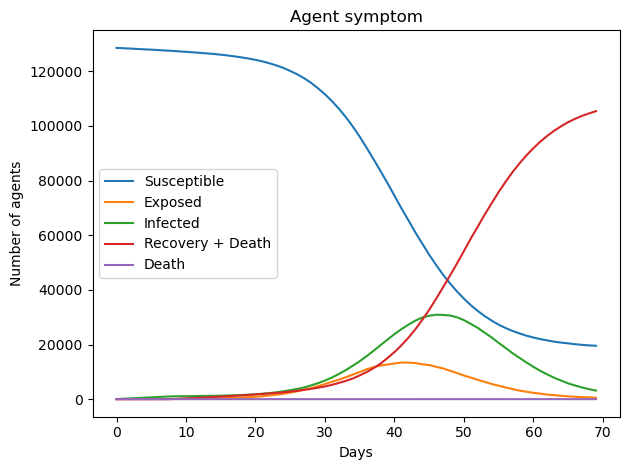
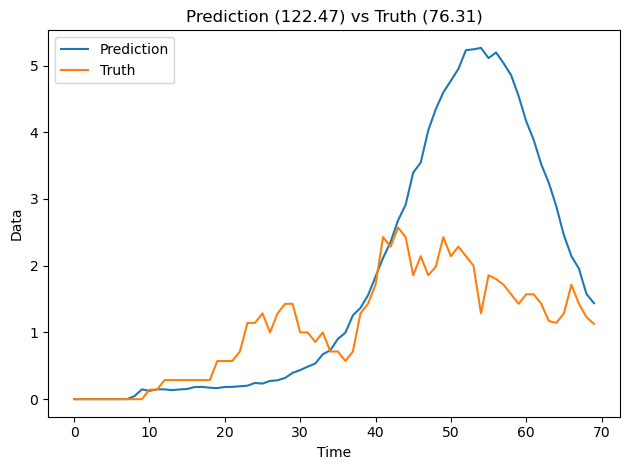
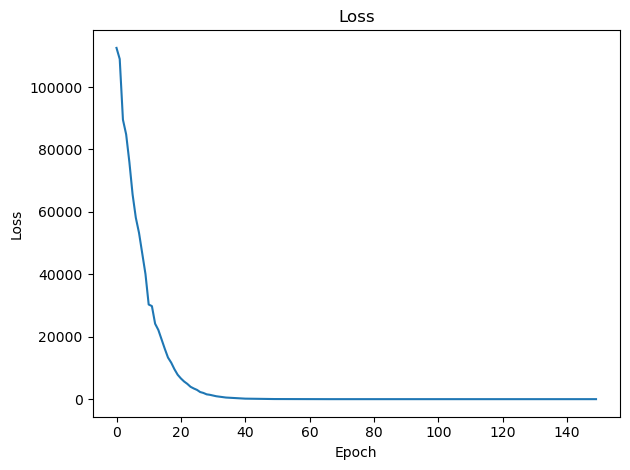
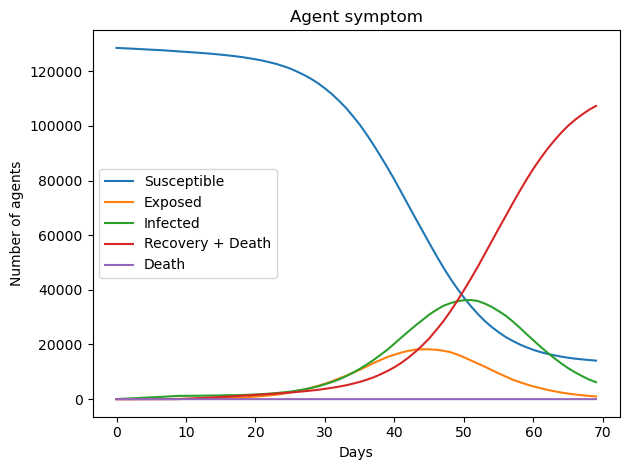
Results comparisons
The following figures show the outputs from various experiments. The model (if a neural network is applied) is trained using a sample dataset from New Zealand, which has a population of 100,000, and the death rate of COVID-19 in May and June 2021.
Experiment |
Tensorized ABM |
Coupling LSTM |
Uncertainty |
|---|---|---|---|
|
Yes |
Yes |
Yes |
|
Yes |
Yes |
No |
|
Yes |
No |
No |
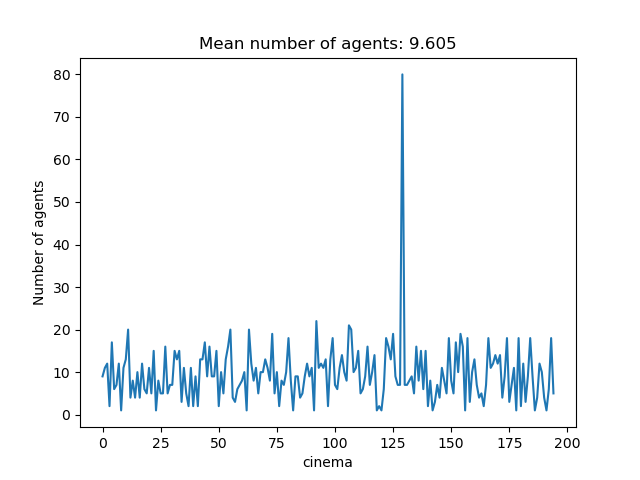
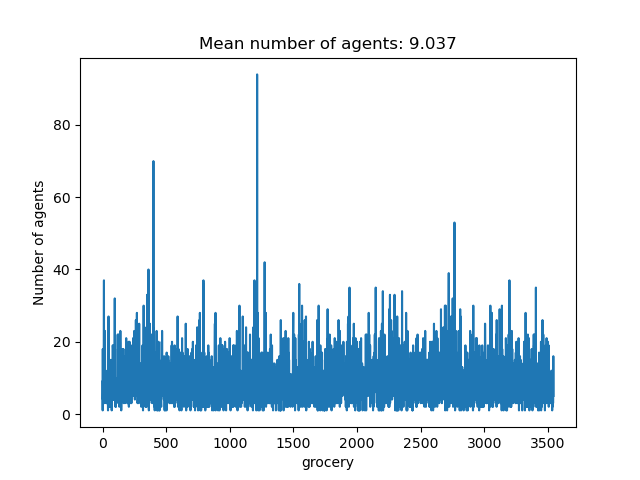
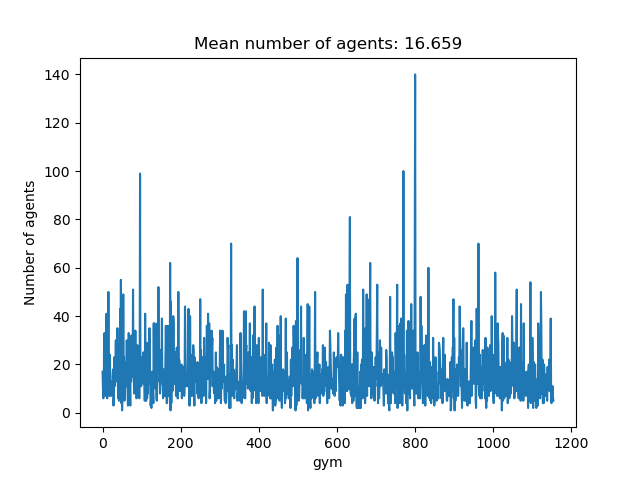
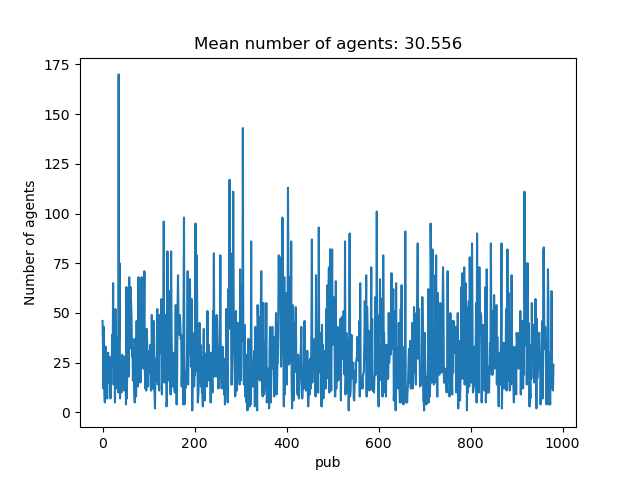
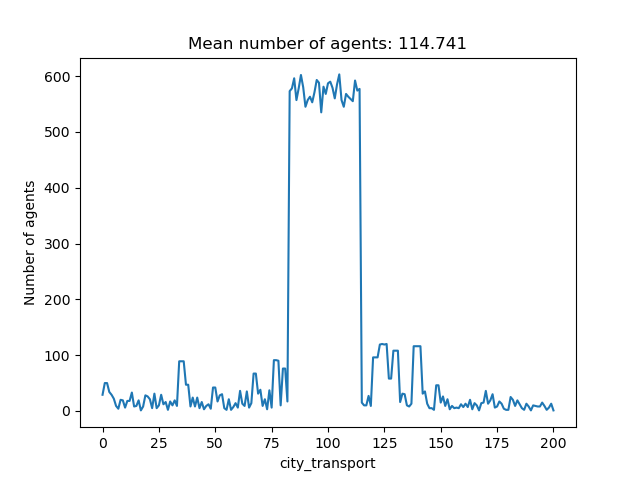
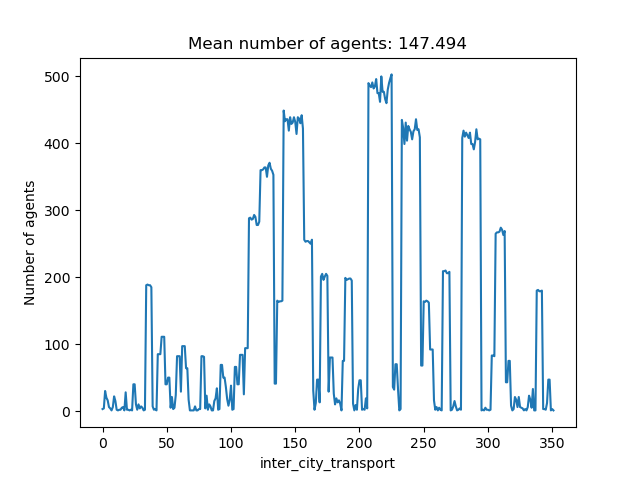
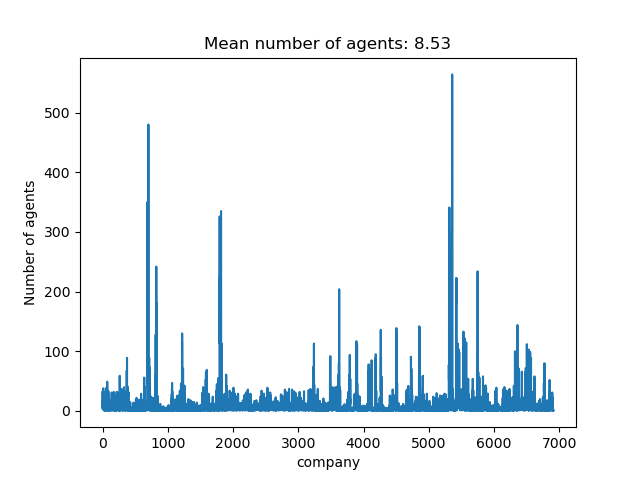
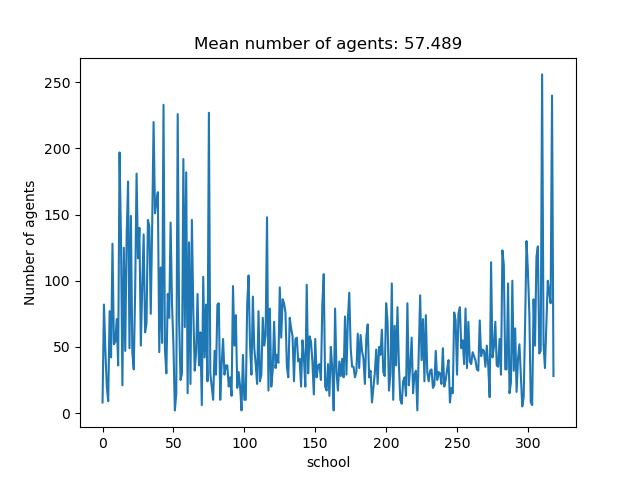
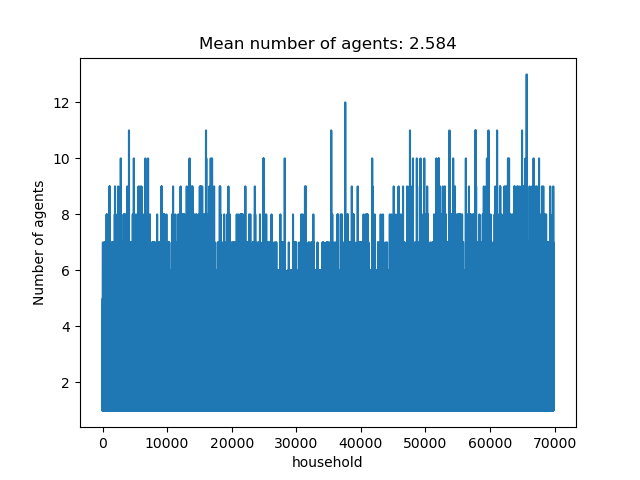
The edges for the graph network for different types of interaction groups can be seen below (the x-axis represents different venues, while the y-axis shows the number of people in that particular venue):